Introduction
The presentation "Physics of 21st Century" by Moskov Amarian of the Department of
Physics,
http://argon.physics.odu.edu/~amarian/PHYS120/NOTES/nuclear.ppt
Shows a yellow graph for nuclear binding energy that Is similar to my S wave but does differ slightly (as it has a logarithmic element).
I will show here that a logarithmic component can reconcile this difference.
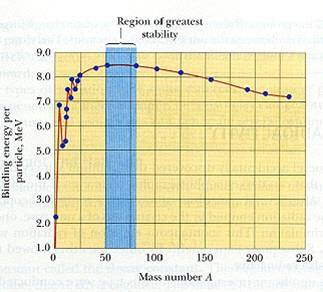
Empirical results for Binding Energy
The graph below does not show a true logarithmic curve but can be explained by combining an S wave with a logarithmic curve.
There is one important consideration to present. That is these results graph all atoms with mass number 0 < A < 251 and not an individual atom as does the S wave.
I am therefore assuming the binding FORCE follows the same pattern in each individual atom.
The graph also has two striking features. Firstly, it has an inconsistency between the binding energy values of 7.0, 5.1, and 6.8 approximately or 5 < A < 13 approximately.
These atomic numbers cover Boron, Carbon, Nitrogen, Oxygen, Flourine, Neon, Sodium, Magnesium, and Aluminium. Perhaps because two elements are gaseous then such an inconsistency is reasonable to expect and should be absent in the individual atomic binding force or S wave.
It was unexpected that the S wave did not act upon a real plane but, from these results, appears to act upon the complex plane where distances are logarithmic.
I shall start with a S wave as shown in green in the above diagram and aim to change a logarithmic curve until it closely resembles the experimental results.
Modifying the S Wave.
I split the graph into two halves to match with distances AB and BC on the S wave (see S Wave Proof 1a and 1b). This shows the a linear function that resembles the S wave between A and B can modify the logarithmic curve as desired.
More surprisingly wave (see S Wave Proof 1c and 1d) we can modify for the S Wave over distance BC by adding a negatively sloping linear function. I chose a function with a slope half that used previously for the distance AB.
Surprisingly not only can I make the logarithmic slope negative I can use a negatively sloping linear function to increase the slope between AB.
Conclusion
These results clearly have huge implications for the S wave. Perhaps in retrospect the S wave acts below Planck distances so it is very likely to act upon the complex plane.
I just did not expect a force with such an important role in real space to do so.
The evidence also suggests that the S wave can be controlled by the negatively sloping phase BC of the S wave.
In reconsidering my theoretical position, I suggest that the S wave undergoes a phase in 3D then one in 4D. The picture now appears to be more complicated but I suggest a system of operation here.
I now define ABC as a 3D phase followed by a similar 4D phase CDA.
AB can represent an expansion of the nucleus (very small according to my previous work but still an effect counterbalanced largely by an attractive F force) in 3D.
BC can then represent an expansion of the nucleus in 4D.
This is followed by CD representing a contraction of the nucleus in 4D and DA representing a contraction of the nucleus in 3D.

